[caption id="attachment_4244" align="alignright" width="241"] Sol Systems CEO Yuri Horwitz[/caption]
Despite the Trump Administration’s recent decision to levy a 30% tariff on the solar industry, we see tremendous opportunity ahead for the industry. In the next year this industry will develop, construct, and finance $25-30 billion in solar assets. It will build 20-25% of the country’s new electricity capacity, and will continue to employ hundreds of thousands of people. The core drivers for this success are (1) public support, (2) rapid technological evolution that drives cost reduction and increased efficiency, and (3) significant and increasing support for the solar asset class by institutional investors. By 2022, we fully expect solar to be the dominant source of new electricity generation in the United States. Here’s why.
America Supports Solar
Despite the current political headwinds, Americans overwhelmingly support renewable energy and believe climate change is real. As poll after poll demonstrates, we give priority to alternative energy sources, overwhelmingly support conservation of energy over extraction, and prioritize the protection of the environment over the amount of energy we produce – now, more than ever. This broad public support will be important in the next decade as we continue to invest in the infrastructure required to support a renewable grid (and we will need to). Depending on geography, solar and wind will scale to provide 35-40% of our country’s energy, and in real time, sometimes much more. As we’ve noted in the past, solar projects will do so at increasingly low costs, and will begin to compete head-on with natural gas.
Competition is Fierce – But Solar Competes
Although natural gas generation fell between 2016 and 2017 from 35% to 32% of total national electricity production, it remained the primary fuel for power generation for the second year in a row, surpassing coal (around 30%) in 2016. Natural gas sets the clearing price in most markets and therefore drives wholesale electricity prices. Natural gas production is projected to continue to climb in to 90 bcf/day in 2019 as new pipelines transport gas from the Appalachian region and from Permian shale.
In the short term, this increased gas supply should depress electricity prices even as natural gas exports increase; the U.S. Energy Information Administration (EIA) forecasts that natural gas prices for electric generators will fall to $3.26/mcf in 2019. However, long-term, there is less certainty. Natural gas discoveries have fallen to a 70-year low and have continued to fall consistently in the last five years. Recent studies also indicate that many gas operators have harvested the least expensive wells to optimize short-term revenue and profitability, leaving more expensive gas in the ground and potentially raising extraction prices with time.
Even assuming these concerns are unfounded, most current electricity projections estimate that on-peak wholesale electricity prices increase to $79-85/MWh (depending on location) by 2039. This price does not include carbon or capacity value, which Wood Mackenzie, ABB and other firms generally do include. This is where utility-scale solar must deliver energy.
Solar is rising to this challenge. Solar PPAs continue to fall in price, and many PPAs executed in 2017 for assets to be delivered in 2018 and 2019 were executed at a levelized cost of energy below the price it takes to support a new natural gas plant. See, for example, GTM’s research below.
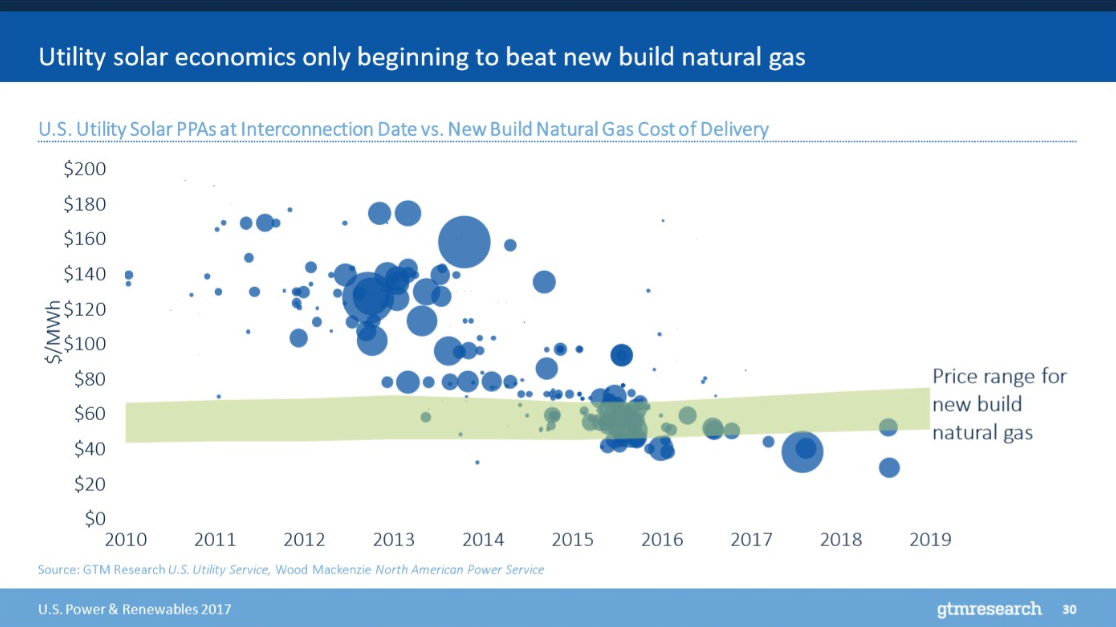
We consistently see pricing in PJM, in the mid and low three cents, and solar, more than any other technology, has demonstrated significant cost reductions over time. We fully expect solar PPA pricing to be driven down further by technological cost reductions and competitive financing.
Solar Costs Will Come Down & Efficiency Will Rise
Module Costs Will Fall & Module Efficiency Will Improve
United States module prices, hit hard by the recent 201 petition, will likely experience sharp downward pressure in Q2 2018. This is because US demand for modules is anemic at the moment. Most large solar projects have their modules, and Credit Suisse estimates that 6.5GW of solar modules were warehoused in anticipation of the tariff. But module supply is stable and growing. Massive Chinese demand, which now composes 40% (54GW) of the global market demand for solar, and a global trend towards manufacturing efficiency and automation across almost all industries, including solar, will continue to drive costs down, and efficiency up.
Pricing for polysilicon (the raw commodity for most solar cells) was fairly stable through H2 2017 at around 16 dollars/kg. We expect those prices to fall to more like 13-14 dollars/kg in the face of falling US demand in 2018, and increasing supply, as companies like Chinese-based GCL and Korean-based OCI ramp up production.
Transforming this raw product into actual solar cells efficiently is also critical in driving down costs. As recently as 2010, an average module utilized in excess of 7 grams/watt of polysilicon. In 2016, the industry utilized 4.8 grams/watt on average, and forecasts show that by 2020, it should achieve 3.6 grams/watt, a 25% decrease in raw material costs in just two years from now. Of course, polysilicon doesn’t solely drive economics, but we expect wafer production, manufacturing, backing, framing and wiring to become less expensive with global scale as well.
In addition to these cost reductions, solar module performance (measured in output per watt) will improve, further reducing the cost of solar energy. Many module manufacturers, like JA, are transitioning old factories to produce higher efficiency monocrystalline PERC technologies which increase efficiency by 2-4%. A third of the global market is now (or soon will be) PERC. You can expect these same manufacturers to also integrate bi-facial technology that enables cells to capture sunlight from the front and the back of modules, increasing yield by 10-15%. Additionally, manufacturers are aggressively pursuing methods to increase the number of bus bars within a module (an estimated 0.5% efficiency gain), and pursuing half-cut technologies that can lead to the similar outcomes.
We expect these changes to drive overall module production costs to approach 20 cents/watt by 2019. Critically, every 10-cent/watt reduction in the cost of modules delivered to port equates to a 13-13.5 cent/watt reduction in consumer costs given the tariff. We fully expect modules to dip below 40 cents/watt in the United States again by Q3 2018 (including the 30% tariff), with a potential low 30 cent module in 2019.
Balance of System (BOS) Costs Will Also Fall & Efficiency Will Improve
Inverter technology is benefiting from global scale and innovation. Chinese manufacturers are entering the space aggressively. Prices, currently at 5-6 cents/watt, should come down 5% annually for the next few years at a minimum. These manufacturers are also leading the push to 1500V architecture, which enables lower installed cost and higher efficiency at a system level. Additionally, string inverters, previously common only for small commercial applications, have become the predominant solution for large commercial and small utility projects. Short-term US solar tracker pricing (12-15 cents/watt for single axis tracking) should follow suit, although recent steel price increases may prevent significant tracker price declines – expect manufacturers like NEXTracker that utilize less steel to benefit.
Solar Energy Can (And Will) Cost Less
None of these projections can be precise, but the general trend is correct. Prices are going down with time, and efficiency is going up, driving down the overall cost of solar energy. We expect to arrive at 95 cent/watt single-axis tracker utility scale solar in 2019-2020, that is more efficient than solar today, resulting in 3 cent/kw utility-scale electricity, which will outcompete natural gas in many locations. By 2020, solar will be the predominant source of new electricity generation capacity in the United States. But cheap electricity is only part of the equation.
[caption id="attachment_5634" align="aligncenter" width="1000"]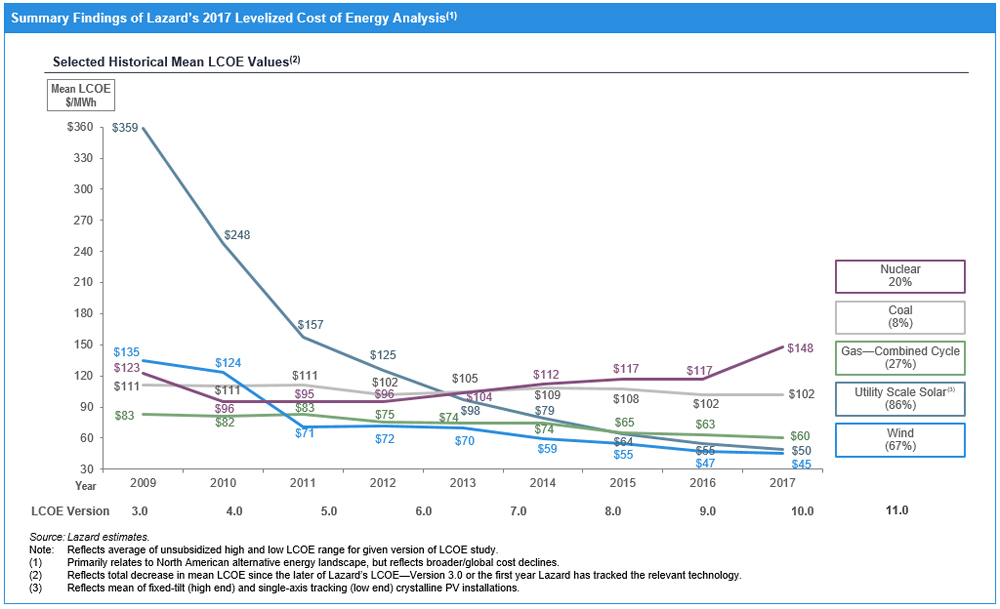 Source: Lazard[/caption]
But Adaption is Key: Time & Place
Truly scaling renewables long-term is not solely dependent upon price, but location and time. As we price 25-year forward electricity curves for solar, regional 8760 analysis (predicting solar production down to each hour in each day in each month) is critical. Pouring enormous amounts of energy into the grid at one time, especially when the customers don’t need it, is not sustainable. ERCOT is one example, where wind delivers energy into negative locational marginal price (LMP) price environments consistently. That’s why the industry needs to continue to focus on (1) shifting the time of day we produce solar, and (2) driving customer demand and simplifying how they secure solar.
Delivering Power at the Right Time
We need to (and will) dramatically scale our deployment of energy storage with lithium ion and flow batteries, as well as small-scale hydro. Energy storage will enable better ramping around generation, frequency regulation, and load shifting. This is why utilities like SDG&E are investing in storage, oil companies are investing in energy management companies, and companies like Siemens and AES have launched a joint venture around storage. Without storage, solar cannot scale in the United States – nor can wind. Luckily, storage costs are expected to decline 10-20% annually for the next decade, and have fallen by 50% in just the last two years. We expect that most California solar projects are accompanied by storage in 2020. We also expect that other types of storage, like flow batteries and pumped water storage will be critical tools in managing load, as they are in California.
Driving Customer Demand
We must continue to empower consumers to choose the energy they want. Otherwise they will secure their energy from utilities and incumbent sources of energy like coal and natural gas. Utilities are not necessarily incentivized to procure more solar through long-term PPAs unless their customers demand it. Sol Systems, along with other renewable energy development firms, will play an important role in helping companies like Microsoft, Apple, Amazon, and Walmart achieve their goals of 100% renewables.
To serve these customers’ needs, we are focused on less complex solar energy products from remote solar projects to complement rooftop solar systems This industry must transition complex power purchase agreements (PPAs) and contract for differences (CFDs) into simplified instruments that mimic normal electricity purchase so that customers can demand a 10-year block of power at a fixed or floating price that’s 50% solar, 30% wind, 20% gas.
Investor Demand for Solar Assets Will Increase – Reducing the Cost of Capital
The cost of capital for solar projects will continue to decrease as investors overwhelmingly migrate into the asset class for a few reasons: (1) stocks are overvalued and investors are looking to diversify, (2) solar asset investments are non-correlated to other assets, (3) these investments are long-dated, (4) US solar assets are dollar denominated, and (5) sovereign wealth funds, pension funds, and insurance companies increasingly must comport with client demands, and internal mandates, to invest in more sustainable assets like solar.
As to the first point, the investment community must constantly adjust their portfolio based on risk and yield. Currently, investors are looking for yield just about anywhere they can find it because public equities and debt are overpriced. In fact, only in two points in the last 136 years have stocks been valued this high; once during the early Dot-Com bubble, and right before the Crash of 1929. And it’s not just stocks where investors seem to be taking on undue risk. Yield spreads have compressed dramatically between stable debt (like US Treasuries) and less stable debt, (like municipal bonds,) indicating investor interest in high yield/risk bonds. This is one way the natural gas boom was financed.
This demand is a function of low interest rates, limited supply of stocks, and a very large (and growing) number of investors. This historically low interest rate environment has pushed capital into stocks because yields are higher, driving a positive feedback loop where stocks valuation increases more. Further, this environment enables corporations to buy back stock through debt – and corporate indebtedness is at an all time high.
There is almost certainly cross-asset valuation conflation, which is to say that all stocks are rising because the market isn’t actually differentiating among fundamentals. This may be because the market doesn’t actually have the liberty to do so. The number of stocks has fallen by close to 50% in the last two decades, and there are now 70x as many indices (3.4 million) as there are actual stocks traded. And the number of people investing in U.S. stocks is growing, as Chinese investors pour money in.
Positive feedback loops spin themselves down as quickly as they spin themselves up (our industry has experienced this first-hand with yieldcos), and amid a bull market in everything, and concern about the future stability of this frothy market, investors are looking for non-correlated assets to help hedge against potential volatility so that even if the stock market or bond market implodes, they preserve their capital investment. Hedge funds are one option, but not always a great one. There is also specific investor interest in long-dated assets that match liabilities for pension funds and insurance companies, and hedge against future risk. There is also a global preference for dollar-denominated investments, especially renewable energy investments.
These fundamentals drive overwhelming interest in the renewable energy asset class, and will do so in the foreseeable future. In three recent examples in the U.S., Alaska Permanente invested in Generate Capital, Temasek (Singapore’s $275 billion national wealth fund) invested with Cypress Creek, and Blackrock closed on $1.65 billion for its Global Renewable Power Fund II on behalf of a number of clients, many of them pension funds and insurance companies.
Two challenges, of course, are rising interest rates and tax reform. Interest rates will rise in 2018, likely between 50-100 basis points. Expect the spread between U.S. Treasuries and interest rates for solar to shrink, but many of the same reasons as above, but for rates to go up nonetheless. This will impact solar, but will also impact all infrastructure. Further, because electricity rates generally rise with interest rates, and solar infrastructure is more valuable when energy rates are higher, solar may benefit in some ways from inflation since it has no fuel costs (like natural gas). in short, while rising interest rates pose challenges for all infrastructure, we expect solar to work through these challenges.
The recent tax legislation had three impacts on tax equity. First, it reduced the overall pool of tax capital because corporations have a 21 percent tax rate, down from 35, reducing tax liability. Second, it reduced the value of depreciation because depreciation directly offset the nominal value of income (not actual liability), and offsetting income to reduce taxes is only as valuable as the effective rate. Third, it includes BEAT provisions that limit investor appetite from some multinationals like Union Bank, Royal Bank of Scotland (RBS), and others. The result is likely a 5-10 cent decrease in solar tax equity credit pricing in the short-term, depending on the actual structure.
Longer-term, tax reform could mean a lower after-tax internal rate of return (although depreciation is accelerated, it is now worth about 60% of what it was prior to tax reform for most corporations) but a higher after-tax return on investment (investors pay less tax on their earnings from project ownership). Different investors prioritize these metrics, and prioritize them differently over time, so expect the tax equity market to take 6-12 months to stabilize. Sol Systems has worked proactively with its investor clients to reshape our tax equity product in advance of tax reform and is now deploying $100 million structured slightly differently.
Overall, we expect the blended unlevered after-tax IRR for utility solar projects to be around 6.50-6.75%. Tax efficiency, tax structuring, and diversified outlooks on future electricity curves (post PPA) mean that this benchmark will vary dramatically for each investor, and investors should stress test their assumptions to ensure they understand where and how these economics work. Overall, we expect this environment supports significant solar development and the industry continues to attract the billions in investment it needs to scale on terms that enable solar assets to outcompete its competitors.
Conclusion
The path ahead for the solar industry is certainly complex, with fierce competition. But the industry is evolving (as it must) and the core strategic drivers support its evolution and growth. In 2018, we remain committed to building a more sustainable, resilient, and dynamic energy infrastructure with our customers, clients, and partners. We are devoted to our work because we believe the renewable energy transition is inevitable, because we believe there is tremendous opportunity in this transition, and because we believe it is the right thing to do. Every generation carries its burdens – this is certainly one of ours. Onward.
ABOUT SOL SYSTEMS
Sol Systems, a national solar finance and development firm, delivers sophisticated, customized services for institutional, corporate, and municipal customers. Sol is employee-owned, and has been profitable since inception in 2008. Sol is backed by Sempra Energy, a $25+ billion energy company.
Over the last eight years, Sol Systems has delivered 650MW of solar projects for Fortune 100 companies, municipalities, universities, churches, and small businesses. Sol now manages over $650 million in solar energy assets for utilities, banks, and Fortune 500 companies.
Inc. 5000 recognized Sol Systems in its annual list of the nation’s fastest-growing private companies for four consecutive years. For more information, please visit www.solsystems.com.